mtools 工具查询日志
mtools 是由 MongoDB 官方实现的一套工具集,具有快速日志查询分析、统计功能,是一组非常好用的 MongoDB 日志分析工具。mtools 包括以下组件:
-
mlaunch:支持快速搭建本地测试环境,可以是单机、副本集、分片集群。
-
mloginfo:获取一个日志文件并报告有关该日志文件的 Default Information。
-
mlogfilter:日志过滤组件,支持按时间检索慢查询、全表扫描操作,支持通过多个属性进行信息过滤,支持输出为 JSON 格式。
-
mplotqueries:支持将日志分析结果转换为图表形式。
-
mlogvis:支持将日志分析结果转换为一个独立的 HTML 页面,实现与 mplotqueries 同样的功能。
下面主要介绍 mloginfo 和 mlogfilter 两种组件的基本使用方法。
前提条件
-
已获取管理控制台登录账号和密码,且已获取集群操作权限。
-
已创建 MongoDB 集群,且集群状态为活跃。
-
已安装 mtools 工具。
mloginfo
-
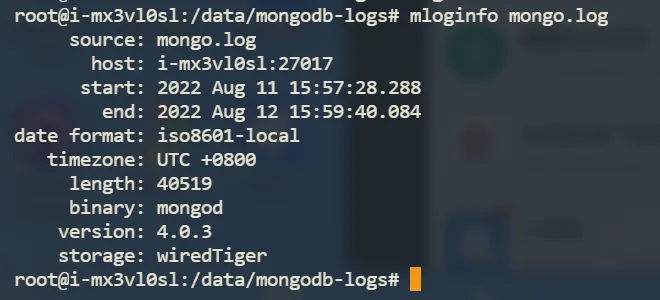
查看日志基本信息。
# mloginfo mongo.log如图所示可查看到日志的起止时间范围、主机端口、版本、数据库引擎等概要信息。
-
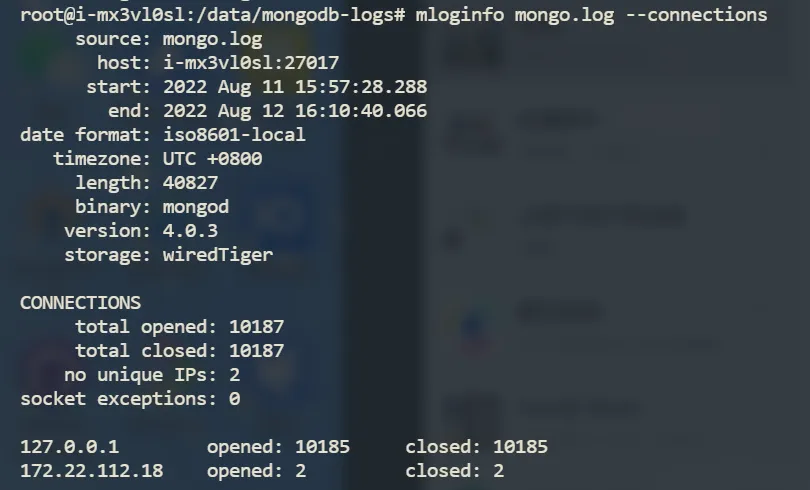
检查客户端的连接数。
# mloginfo mongo.log --connections显示如下类似信息。
-
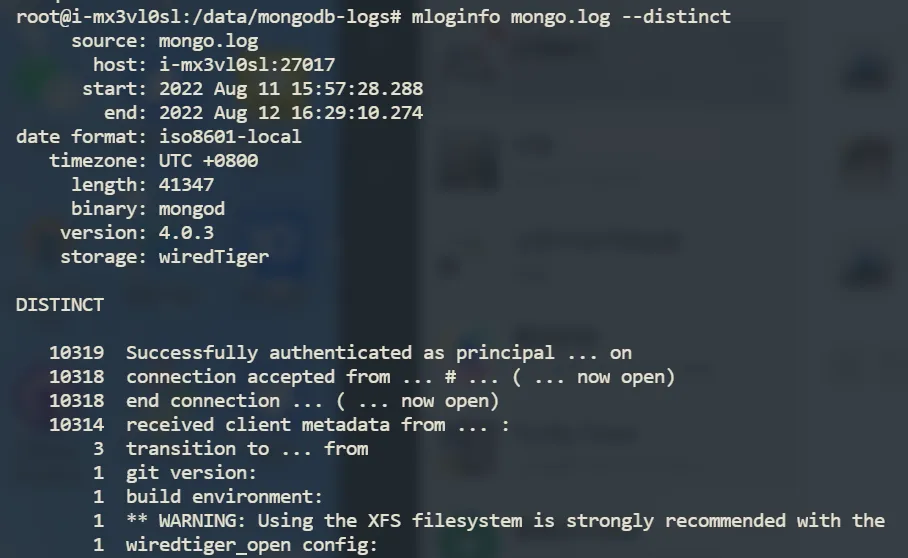
事件统计,统计当前某些事件的发生频次。
# mloginfo mongo.log --distinct显示如下类似信息。
-
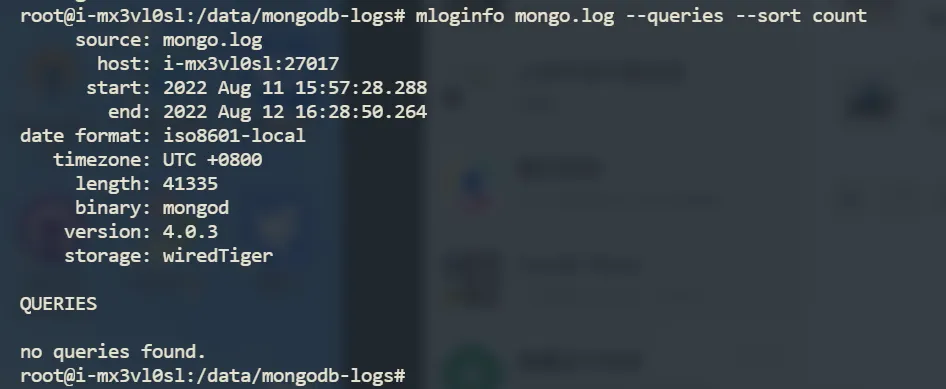
慢查询。
# mloginfo mongo.log --queries --sort count显示如下类似信息。
-
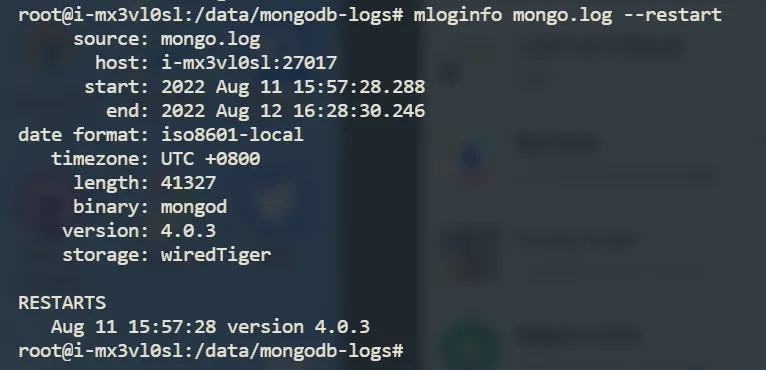
重启信息,对系统潜在的故障进行评估分析。
# mloginfo mongo.log --restart显示如下类似信息。
-
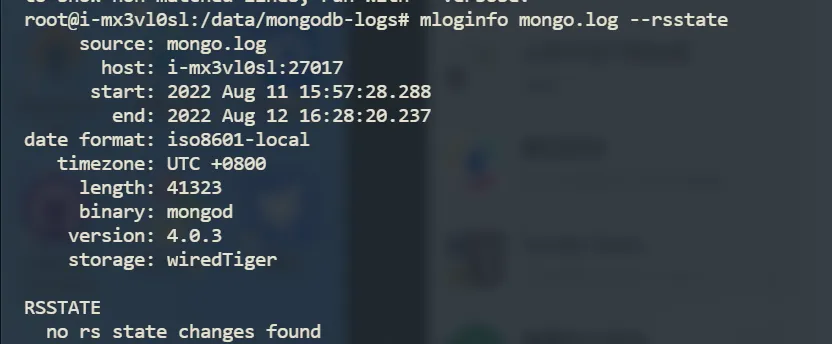
副本集切换。
说明 主备切换可能导致一定的业务失败,需要定期监测对系统潜在的故障进行评估分析。
# mloginfo mongo.log --rsstate显示如下类似信息。
mlogfilter
mlogfilter 可灵活的设置日期条件,包括指定起始、结束时间以及通过偏移量划分范围等。
-
查看超过10s的慢操作。
# mlogfilter mongo.log --slow 10000 --shorten 200显示如下类似信息。
# mlogfilter mongo.log --slow 10000 --shorten 200 2018-05-18T21:49:04.069+0800 I REPL [ReplicationExecutor] Starting an election, since we've seen no PRIMARY in the past 10000ms 2018-05-18T21:50:22.988+0800 I COMMAND [conn31] command dmspace.fs.chunks appName: "Mong...quireCount: { w: 46 } }, oplog: { acquireCount: { w: 46 } } } protocol:op_command 10804ms 2018-05-18T21:50:22.988+0800 I COMMAND [conn44] command dmspace.DeviceInfo command: inse...quireCount: { w: 16 } }, oplog: { acquireCount: { w: 16 } } } protocol:op_command 10931ms 2018-05-18T21:50:22.988+0800 I COMMAND [conn157] command dmspace.Lwm2mDevice command...quireCount: { w: 16 } }, oplog: { acquireCount: { w: 16 } } } protocol:op_command 10762ms 2018-05-18T21:50:22.988+0800 I COMMAND [conn156] command dmspace.TaskHistory command: in...quireCount: { w: 16 } }, oplog: { acquireCount: { w: 16 } } } protocol:op_command 10927ms 2018-05-18T21:50:50.104+0800 I COMMAND [conn31] command dmspace.DeviceInfo appName: "Mon...quireCount: { w: 16 } }, oplog: { acquireCount: { w: 16 } } } protocol:op_command 10020ms 2018-05-18T21:50:51.203+0800 I COMMAND [conn156] command dmspace.fs.chunks command: inse...quireCount: { w: 51 } }, oplog: { acquireCount: { w: 51 } } } protocol:op_command 10823ms -
查看慢扫描操作。
慢扫描是指该操作需要扫描过多的记录(超过 1w 行),且返回数量不足扫描数量的1/100,该操作通常对 CPU 消耗很高,也比较低效。
# mlogfilter mongo.log --scan --shorten 200显示如下类似信息。
# mlogfilter mongo.log --scan --shorten 200 2018-05-18T21:57:09.123+0800 I COMMAND [conn683] command cmspace.USER_LOGIN_HISTORY command: find ...e: { acquireCount: { r: 95 } }, Collection: { acquireCount: { r: 95 } } } protocol:op_command 556ms 2018-05-18T21:57:17.381+0800 I COMMAND [conn784] getmore nsspace.StatisticsDay query: { aggre...nt: { r: 10 }, timeAcquiringMicros: { r: 1667 } }, Collection: { acquireCount: { r: 890 } } } 214ms 2018-05-18T22:06:16.148+0800 I COMMAND [conn764] getmore nsspace.StatisticsHour query: { aggr...} }, Database: { acquireCount: { r: 69128 } }, Collection: { acquireCount: { r: 69128 } } } 12053ms 2018-05-18T22:06:24.962+0800 I COMMAND [conn764] getmore nsspace.StatisticsHour query: { aggr... } }, Database: { acquireCount: { r: 69106 } }, Collection: { acquireCount: { r: 69106 } } } 8782ms 2018-05-18T22:06:33.787+0800 I COMMAND [conn764] getmore nsspace.StatisticsHour query: { aggr... } }, Database: { acquireCount: { r: 69111 } }, Collection: { acquireCount: { r: 69111 } } } 8822ms -
根据名称空间过滤。
# mlogfilter mongo.log --namespace dmspace.DeviceInfo显示如下类似信息。
# mlogfilter mongo.log --namespace dmspace.DeviceInfo 2018-05-18T21:50:58.105+0800 I COMMAND [conn31] command dmspace.DeviceInfo appName: "MongoDB Shell...adata: { acquireCount: { w: 16 } }, oplog: { acquireCount: { w: 16 } } } protocol:op_command 2963ms 2018-05-18T21:50:59.195+0800 I COMMAND [conn31] command dmspace.DeviceInfo appName: "MongoDB Shell...tadata: { acquireCount: { w: 16 } }, oplog: { acquireCount: { w: 16 } } } protocol:op_command 936ms 2018-05-18T21:51:00.173+0800 I COMMAND [conn44] command dmspace.DeviceInfo command: insert { inser...tadata: { acquireCount: { w: 16 } }, oplog: { acquireCount: { w: 16 } } } protocol:op_command 745ms 2018-05-18T21:51:00.433+0800 I COMMAND [conn44] command dmspace.DeviceInfo command: insert { inser...tadata: { acquireCount: { w: 16 } }, oplog: { acquireCount: { w: 16 } } } protocol:op_command 252ms -
根据操作类型过滤。
# mlogfilter mongo.log --operation update显示如下类似信息。
# mlogfilter mongo.log --operation update 2018-05-18T21:56:25.114+0800 I WRITE [conn156] update dmspace.PolicyTask query: { _id: "###" } pla...Count: { w: 2 } }, Metadata: { acquireCount: { w: 1 } }, oplog: { acquireCount: { w: 1 } } } 2630ms 2018-05-18T21:56:25.114+0800 I WRITE [conn92] update nsspace.TimerTask query: { _id: "###" } planS...Count: { w: 2 } }, Metadata: { acquireCount: { w: 1 } }, oplog: { acquireCount: { w: 1 } } } 1264ms 2018-05-18T21:56:25.125+0800 I WRITE [conn43] update dmspace.TaskHistory query: { _id: "###" } pla...Count: { w: 2 } }, Metadata: { acquireCount: { w: 1 } }, oplog: { acquireCount: { w: 1 } } } 2643ms 2018-05-18T21:56:30.027+0800 I WRITE [conn532] update dmspace.TaskHistory query: { _id: "###" } pl...eCount: { w: 2 } }, Metadata: { acquireCount: { w: 1 } }, oplog: { acquireCount: { w: 1 } } } 868ms 2018-05-18T21:56:32.115+0800 I WRITE [conn517] update dmspace.TaskHistory query: { _id: "###" } pl...eCount: { w: 2 } }, Metadata: { acquireCount: { w: 1 } }, oplog: { acquireCount: { w: 1 } } } 497ms -
获取某时间点之后1小时的日志。
# mlogfilter mongo.log --from Apr 6 0:00 --to "+1h" | tail -n3显示如下类似信息。
# mlogfilter mongo.log --from Apr 6 0:00 --to "+1h" | tail -n3
2018-05-19T00:59:59.876+0800 I COMMAND [conn16386] command nsspace.StatisticsHour command: find { find: "###", filter: { user: "###", region: "###", appKey: "###", recordTime: { $lte: "###" }, $and: [ { recordTime: { $gte: "###" } } ] }, shardVersion: [ "###", "###" ] } planSummary: ### keysExamined:249767 docsExamined:249767 cursorExhausted:1 numYields:1952 nreturned:84 reslen:29748 locks:{ Global: { acquireCount: { r: 3906 } }, Database: { acquireCount: { r: 1953 } }, Collection: { acquireCount: { r: 1953 } } } protocol:op_command 319ms
2018-05-19T00:59:59.879+0800 I COMMAND [conn15998] command nsspace.StatisticsHour command: find { find: "###", filter: { user: "###", region: "###", appKey: "###", recordTime: { $lte: "###" }, $and: [ { recordTime: { $gte: "###" } } ] }, shardVersion: [ "###", "###" ] } planSummary: ### keysExamined:249767 docsExamined:249767 cursorExhausted:1 numYields:1954 nreturned:84 reslen:29833 locks:{ Global: { acquireCount: { r: 3910 } }, Database: { acquireCount: { r: 1955 } }, Collection: { acquireCount: { r: 1955 } } } protocol:op_command 321ms